Preparation
View Lloyd Rieber's pre-recorded presentation of an instruction to quantitative research methods, corresponding to chapters 8-11 of the 10th edition of the Leedy and Ormrod textbook. This can be found on your course learning plan.
Directions
In this activity, you will compute the mean, standard deviation, and z scores of a data set emailed to you. You will need to create a new Excel spreadsheet file. Title it as "yourLastName-statistics1.xls" (e.g. Jones-statistics1.xls).
Lloyd Rieber has prepared a video tutorial for you. Follow the video instructions carefully as you work with Excel. When finished, email your Excel file as an attachment to Lloyd Rieber at lrieber@uga.edu with the subject line: "yourLastName - Statistics Activity 1."
The video is approximately 20 minutes in length and is presented in 3 parts. Click on each of the following to launch the video segment in a new window:
- Part 1: Computing the mean (6:18)
- Part 2: Computing the standard deviation (10:04)
- Part 3: Computing a z score (standard score) for each participant in the data set (4:07)
Note: Excel 2003 was used on a Windows computer to make the video. Newer versions of Excel have different user interfaces, such as putting the functions within a palette. Even if your version of Excel has a different interface, this video should be sufficient to guide you through the activity.
I hope you will enjoy this activity and find it relevant and satisfying.
Excel extra
Instead of manually entering "10" for the number of participants (cell A24 in the video example), use the function COUNTA instead:
=COUNTA(A11:A20)
This function counts the number of cells that are not empty in the given range. The advantage of this is that as the number of participants grows or shrinks, the total number will be updated automatically.
Resources
You will use two formulas in this activity. Consult these formulas often as you complete the activity.
The first is the formula for computing the standard deviation:
This formula is explained on pgs. 286-288 in the Leedy and Ormrod textbook (9th edition: pgs. 269-270) (although they use M to symbolize the mean). (Note: this formula is also often shown with "N-1" for the denominator. The nuances of when to use each will not be explored here.)
The second is the formula for computing a z score, also known as a standard score:
This formula is explained briefly on pgs. 288-290 in the Leedy and Ormrod textbook (9th edition: pgs. 271-272).
z scores are used to compare two scores in the same distribution. They are also used to compare two scores from different distributions, even when the distributions are measuring different things. z scores from two distributions can be compared, but raw scores cannot (unless the means are equal and the standard deviations are equal).
A z score of 1 is exactly one standard deviation above the mean. Likewise, a z score of -1 is exactly one standard deviation below the mean.
Here is graphic of the normal curve showing the standard deviations. Another version of this is on p. 255 of the Leedy and Ormrod text. A z score of 0 equals the mean of the distribution.
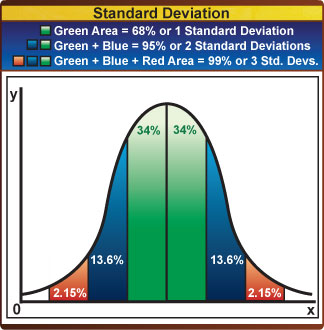
Source: http://www.ifa.com/images/12steps/step8/f8-1.jpg